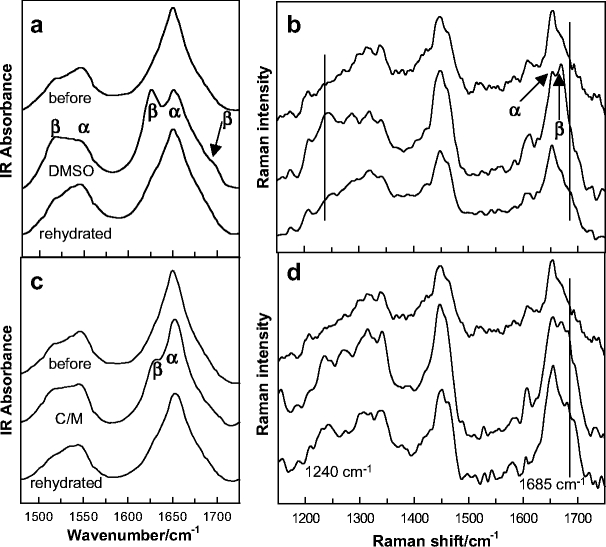
Fig. 2.

Solvent-induced conformational changes in the keratin of single corneocytes. a and b IR and Raman spectra, respectively, of an isolated corneocyte prior to and following immersion in DMSO, and after an overnight rehydration period (top to bottom, respectively). c and d IR and Raman spectra, respectively, of a corneocyte prior to and following C/M treatment, and after an overnight rehydration period (top to bottom, respectively). In the IR spectra (a and c), α-helical and β-sheet components of the Amide I (ca. 1,650 cm−1) and II (ca. 1,500–1,550 cm−1) bands are noted. In the Raman spectra (b and d), α-helical and β-sheet components of the Amide I are marked along with disordered constituents at 1,685 cm−1. One component of the Amide III band is marked at 1,240 cm−1
