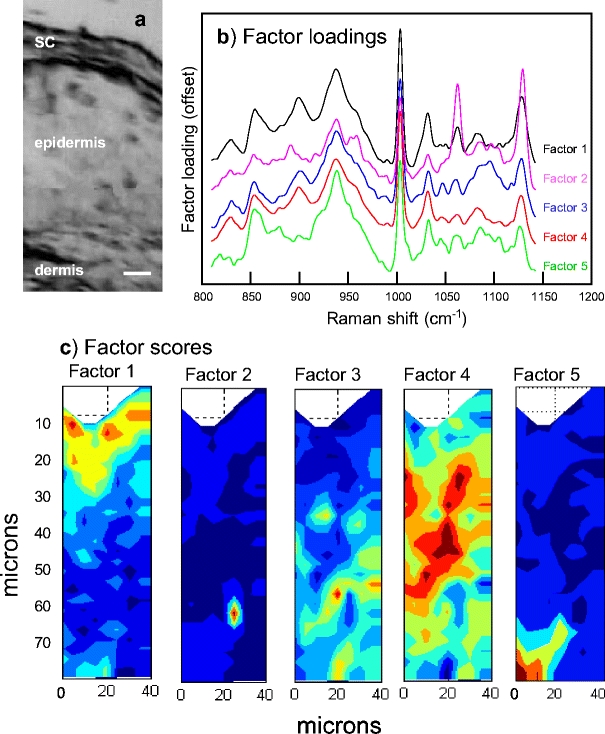
Fig. 3.

a An optical micrograph of a microtomed 5-μm-thick pigskin section acquired using the PerkinElmer Spotlight (bar = 10 μm). The results of factor analysis in the 800–1,150 cm−1 region conducted on a confocal Raman map acquired from intact pigskin. b The five distinct factor loadings generated by the ISys score segregation algorithm (see Materials and methods) are offset and labeled Factor 1–5. c The spatial distribution of factor scores for each of the loadings as marked. Dark blue indicates the lowest score with green, yellow, orange, and red indicative of progressively higher scores. Factor loadings and score images have been assigned to different micro regions in skin as described in the text
