Fig. 4.

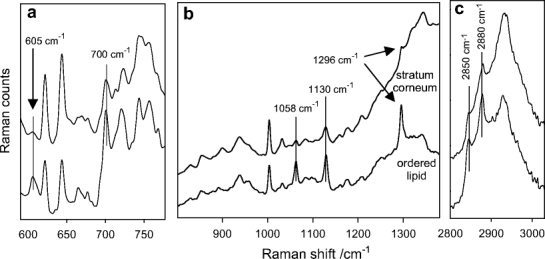
Averaged Raman spectra from within the stratum corneum (top) and lipid (bottom) regions as noted in Fig. 3b and c as Factor 1 and 2, respectively. a The 590–790 cm−1 region with bands assigned to cholesterol marked at 605 and 700 cm−1. b The 800–1,380 cm−1 region displays several bands (1,058, 1,130, and 1,296 cm−1) characteristic for ordered (all-trans) lipid acyl chains. c The CH stretching region (2,800–3,030 cm−1) with methylene symmetric (2,850 cm−1) and asymmetric (2,880 cm−1) stretching modes noted. The frequencies and relative intensity of the bands are consistent with well-ordered lipid acyl chains
