
Fig. 5.
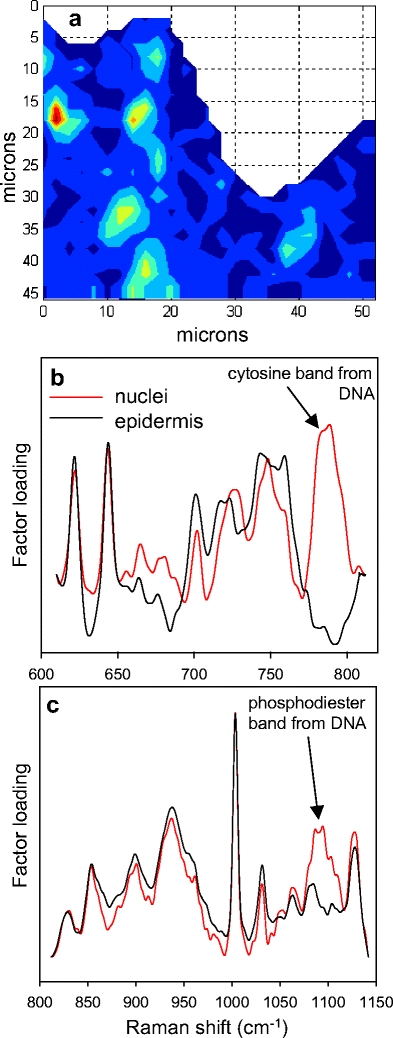
The results of factor analysis conducted in two separate spectral regions for a confocal Raman map of pigskin after stratum corneum removal by tape stripping. Both analyses were performed allowing the generation of only two factors. In each case, one factor contained a spectral feature specific to DNA and the other mapped in a fairly uniform way throughout the epidermal region. a Factor score image for the factor-labeled nuclei shown in (b) with red corresponding to the highest score and dark blue to the lowest. b Factor loadings for the 600–820 cm−1 region with a distinctive vibrational band at approximately 785 cm−1 assigned to cytosine. c Factor loadings for the 800–1,150 −1 region with a second characteristic DNA vibrational band due to the phosphodiester backbone stretching mode, at about 1,090 cm−1 noted