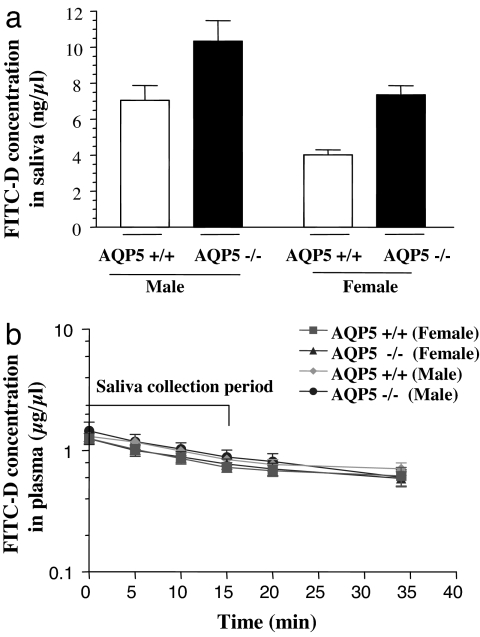
Fig. 2.
Measurement of transport. (a) Comparison of concentration of FITC-D in saliva collected in 15 min between AQP5+/+ and AQP5−/− mice of each gender (n = 7 +/+ males; n = 6 −/− males; n = 6 +/+ females; n = 5 −/− females). (b) Plasma concentration of FITC-D in plasma. Blood samples were collected from the tail vein at 0-, 5-, 10-, 15-, 20-, and 35-min time points after the start of saliva collection.

