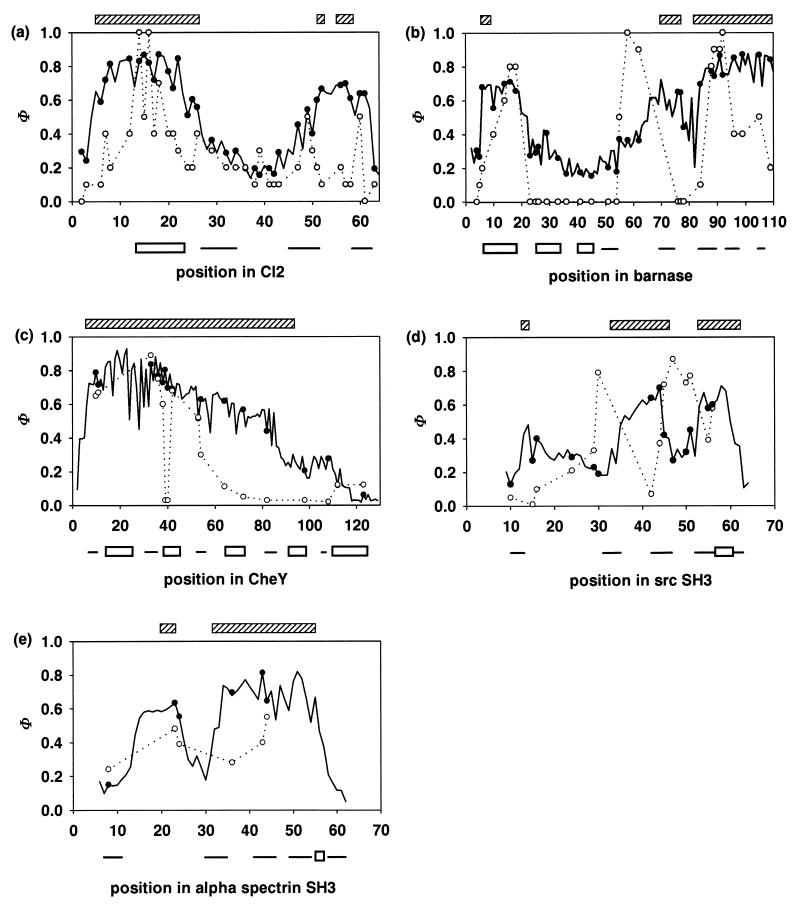
Figure 3.
Unfolding nuclei: correlation of theoretical and experimental results for CI2 (a), barnase (b), CheY (c), the src SH3 domain (d), and the α-spectrin SH3 domain (e). Hatched rectangles at the top of each plot show how the nucleus of the minimal free energy is located in the protein chain according to the calculations. The experimental Φf factors are shown with open circles (connected by dotted line for better presentation). The Φ factors calculated for the ensemble of the possible transition states are shown as a solid line with filled circles (the circles correspond to residues with experimentally determined Φf values). The experimental data do not include negative Φf values, because they have no clear structural interpretation (38); Φf values exceeding 1 are taken as 1; when various mutations give different Φf values, we take the highest ones. For barnase, we take Φf as 1-Φu (37) because its unfolding (u) at high denaturant concentration, as well as folding/unfolding at moderate concentration, is a two-state process, whereas its folding in water proceeds via a metastable intermediate (37). The rectangles and lines (at the bottom of each plot) show the native positions of the α-helices and the β-strands in the chain.

