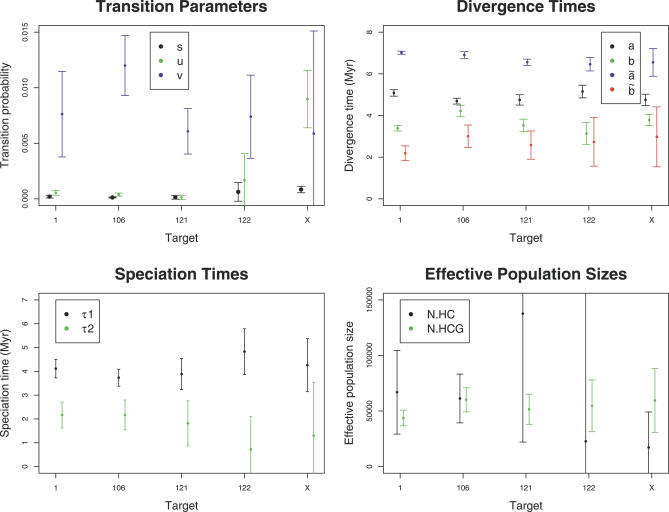
Figure 4. Parameter Estimates from Coal-HMM Analysis of Five Targets.
Estimates with associated standard errors of the HMM and population genetics parameters for the five targets. Top left plot shows the HMM transition rates, top right plot the genetic divergence times in million years (assuming orangutan divergence 18 Myr ago), bottom left plot the speciation times in million years, and bottom right plot the ancestral effective population sizes, again assuming orangutan divergence of 18 Myr and a generation time of 25 y for all species throughout the HCGO divergence.

