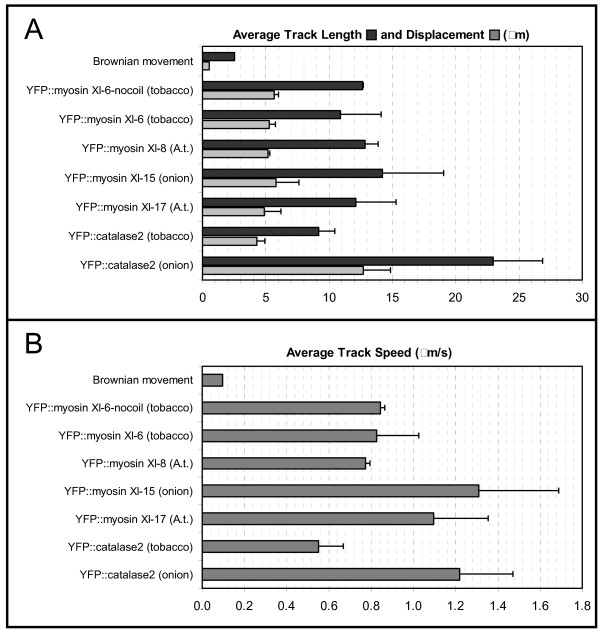
Figure 4.
Organelle Motility. A) Track length, track displacement and (B) average speed of labeled organelles were analyzed on 2D time series. The data represents the mean values from at least 3 different experiments and a range of 300–3000 organelles were analyzed by construct. The plant material used for the labeled organelle motility determination is marked in brackets.

