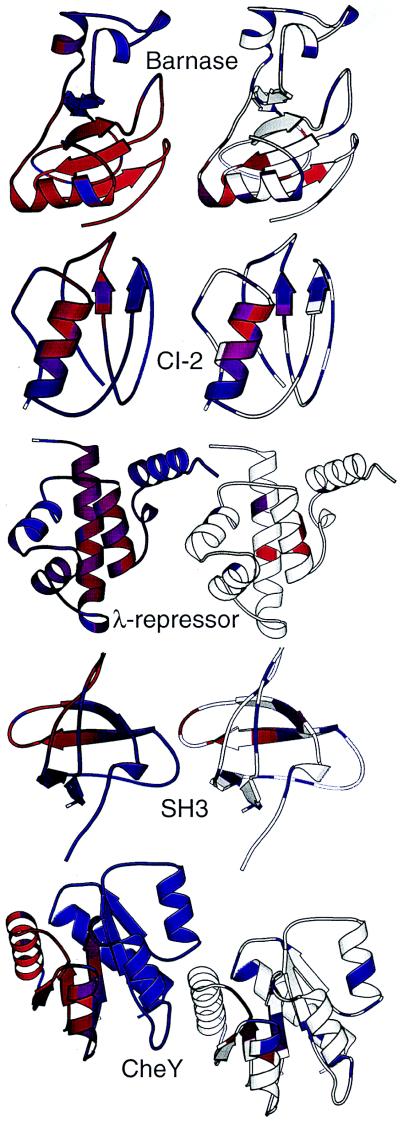
Figure 3.
Comparison of computed and experimental φ values. (Left) Protein structures are shown colored by φ-values computed directly from the sequential binary collision model. Red indicates residues that are important in stabilizing the folding transition state (high φ-values), and blue indicates residues that do not stabilize the transition state. (Right) Structures colored by experimentally observed φ-values; residues with a phi-value of 0 are colored blue, residues with a φ-value of 1 are colored red; purple shades indicate residues with intermediate φ-values, and white regions indicate residues for which there are no experimental data.

