Figure 4.
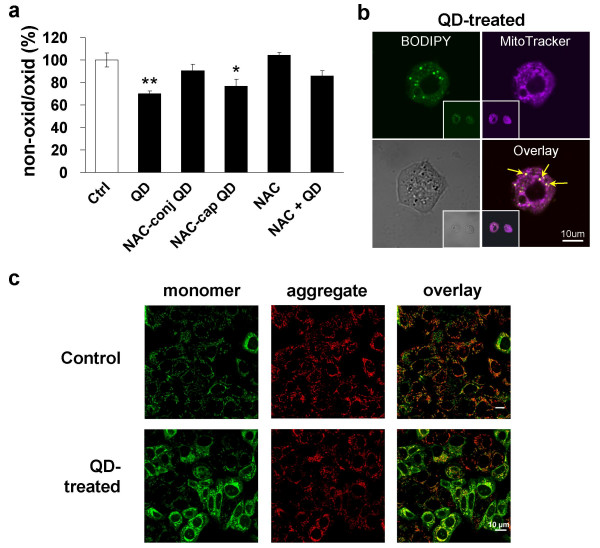
QD-induced mitochondrial lipid peroxidation and change in membrane potential. a. Spectrofluorometric assessment of lipid membrane peroxidation by ratiometric approach in untreated (Ctrl) or QD-treated cells. The ratio between the red and green fluorescence in the control was taken as 100% and all other values with NAC or QD treatments were expressed relative to it. All values are means from quadruplicate measurements and are obtained from three independent (N = 12) experiments (*p < 0.05; **p < 0.01). b. Confocal micrograph showing dual labeling of oxidized lipids (green fluorescence from oxidized BODIPY-C11) within mitochondria (labeled with MitoTracker Deep Red 633). Insets show two adjacent cells from the same field. Scale bar = 10 μm. c. Confocal micrographs of SH-SY5Y cells labeled with JC-1 reveal decrease in mitochondrial membrane potential after QD treatment. Cells were treated with 5 μg/mL QD and typical change in fluorescence from red (Em = 590 nm) to green (Em = 530 nm) was assessed in cell cultures in serum-free medium (control) or QD (5 μg/mL). Note an enhanced intensity of green fluorescence in QD-treated cells. The micrograph illustrates the loss in mitochondrial potential upon oxidative stress induced by QDs. Scale bar = 10 μm.

