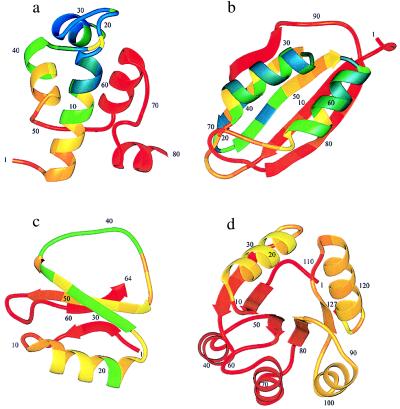
Figure 2.
Structures of monomeric λ repressor (a), muscle acyl phosphatase (b), CI2 (c), and Che Y (d) showing by the color code the theoretical φ values for each position in the protein (see text). The φ values increase with decreasing wavelength, from red (φ = 0) to yellow (φ = 0.5) to blue (φ = 1). These φ values are calculated in the small perturbation limit, i.e., ΔRTlnK = 0.1 kcal⋅mol−1. The φ value pattern in Che Y requires some explanation because it is a three-state protein. The experiments report the φ values from unfolding kinetics (30) whereas the calculation shown here is for the folding rate from the completely denatured state. Because the N-terminal subdomain is already folded in the intermediate, the folding rate (i.e., the smaller eigenvalue) is insensitive to mutations in this area since they affect the intermediate and the transition state equally.

