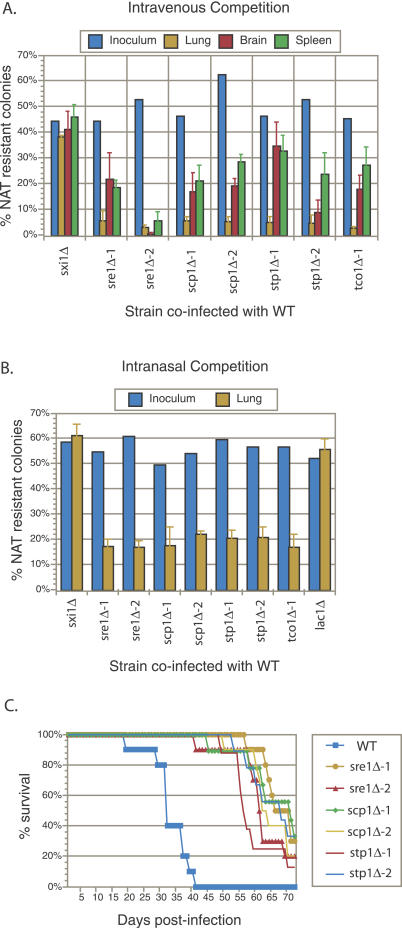
Figure 6. Hypoxia-Sensitive Mutants Display Proliferation and Virulence Defects.
(A) Tail vein inoculation competition experiments. Approximately 1:1 mixtures of wild-type (WT) and the indicated mutant (marked with a NAT resistance gene) were injected into mice (A/J) intravenously via the tail vein (2 × 10⁶ total cells/mouse). The actual proportion of mutant cells in each inoculum were determined by plating a dilution of the inoculum on nonselective medium and then assaying 100–200 individual colonies for NAT resistance. At 10 d post-infection, animals were sacrificed and the lungs, brains, and spleen from each animal were homogenized and serial dilutions were plated. Then, 100–200 colonies per organ were assayed for NAT resistance to determine the percentage of mutant cells. Error bars represent the standard deviation from four mice per inoculum.
(B) Intranasal inoculation competition experiments. Approximately 1:1 mixtures of wild-type and the indicated mutant were inoculated intranasally into mice (A/J) (5 × 10⁵ total cells/mouse). The actual proportions of mutant cells were determined as in (A). At 21 d post-infection, animals were sacrificed and the lungs from each animal were treated as in (A). Error bars represent the standard deviation from four mice per inoculum.
(C) Virulence assays. Eight to ten mice (A/J) were injected intravenously via the tail vein with 2 × 10⁵ cells of the indicated strain and progression to severe morbidity was monitored.

