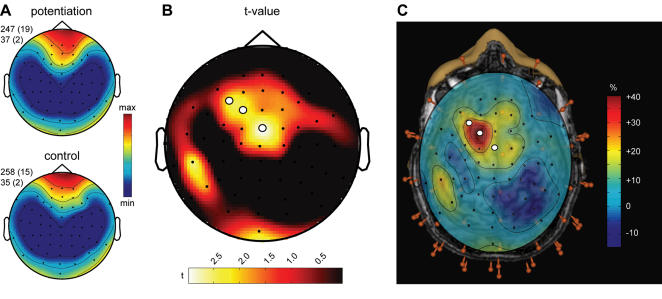
Figure 2.
Changes in local SWA homeostasis during sleep after 5-Hz rTMS conditioning. A. Topographic distribution of SWA after 5-Hz conditioning (top) and the sham control (bottom) condition. Average EEG power density at 1–4.5 Hz (n = 10 subjects) for the first 30 minutes of NREM sleep. Values were normalized by total power for the recording, color coded, plotted at the corresponding position on the planar projection of the scalp surface, and interpolated (biharmonic spline) between electrodes (dots). Values to the left of the topographic plots represent maximal and minimal power (in percentage of the overall mean) with standard errors in parenthesis. B. Topographic distribution of the t-value for the comparison between the 5-Hz conditioning and sham control condition (two-tailed paired t-test). White dots indicate electrodes showing significant differences after statistical non-parametric mapping (see methods). C. Anatomical localization of the three electrodes showing a significant difference in SWA during the first 30 min of NREM. All 60 electrodes (red pins) were digitized and co-registered with the subject's magnetic resonance images. When the topographic distribution of the percentage change of SWA after the TMS conditioning compared to the control condition was projected onto the brain, the three significant electrodes projected onto left premotor cortex (white dots).

