Figure 3.
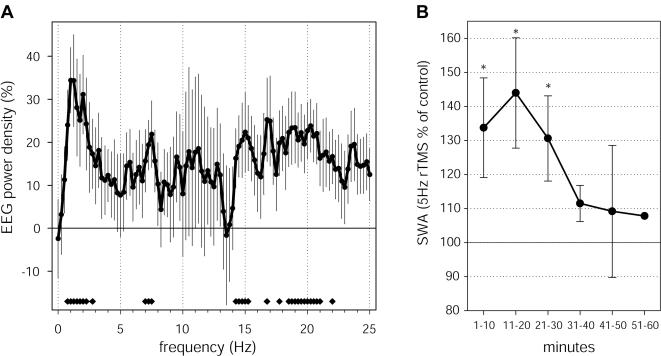
Characteristics of the local SWA change after 5-Hz rTMS conditioning. A. Frequency-specificity of power changes. EEG power density spectrum for the first 30 minutes of NREM sleep. Average power change across subjects for electrode 9, where the peak SWA increase was observed. Values represent the % change after the 5-Hz conditioning with respect to after the sham control condition (mean±SEM for 0.25-Hz bins, n = 10). Bottom bars indicate frequency bins for which power in the 5-Hz conditioning condition differed significantly from the sham control condition (two-tailed paired t-test). B. Time course of SWA changes after 5-Hz conditioning. The change in average EEG power in the 1–4.5 Hz band was calculated for 6 consecutive 10-min intervals during the first NREM sleep episode. As in A, we selected power at electrode 9, corresponding to the peak SWA increase. Stars indicate a significant increase of SWA after the 5-Hz conditioning compared to the sham control condition (p<0.05, two-tailed paired t-test).

