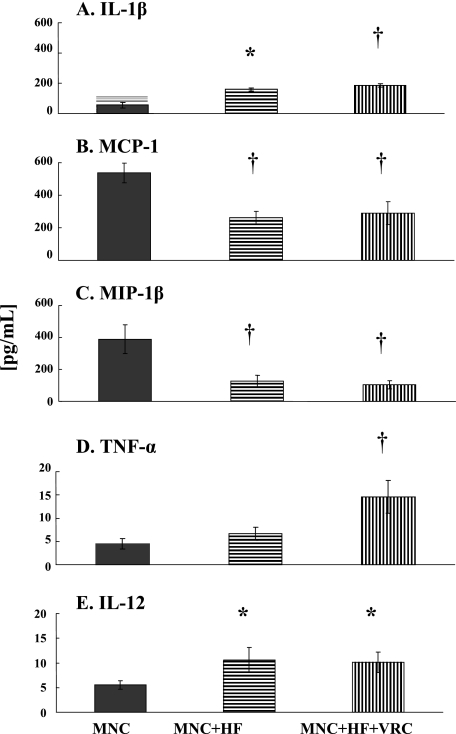
FIG. 1.
Profiles of IL-1β (A), MCP-1 (B), MIP-1β (C), TNF-α (D), and IL-12 (E) cytokine levels released after incubation of THP-1 cells (MNC) alone (dark columns), with A. fumigatus HF without VRC (MNC+HF) (horizontally striped columns), or in the presence of 0.1 μg/ml VRC (MNC+HF+VRC) (vertically striped columns) at 37°C for 6 h. Data are presented as means ± standard errors of the means derived from five donors/experiments. Comparisons between treated and control cells were performed using analysis of variance with Dunnett's test for multiple comparisons. Cells with P values of <0.05 are indicated by asterisks, and those with P values of <0.01 are indicated by daggers (†).

