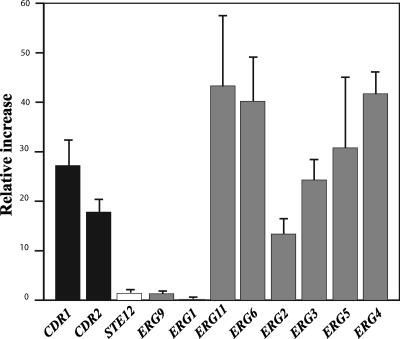
FIG. 2.
Gene expression level in isolate 21229 compared with isolate 21231. The expression levels of genes coding for ABC transporter (CgCDR1 and CgCDR2; black bars), a MAP-activated transcription factor involved in pseudohyphal growth (STE12; white bar), or enzymes involved in ergosterol biosynthesis (ERG1, ERG2, ERG3, ERG4, ERG5, ERG6, ERG9, ERG11; gray bars) were determined by RT-PCR. The relative increase (RI) in expression of the studied genes in isolate 21229 was determined as follows: RI = 2 exp[(Ct gene − Ct actin)isolate 21229 − (Ct gene − Ct actin)isolate 21231]. Ct (cycle threshold) is defined as the number of cycles for which the curve representing the fluorescence intensity according to the number of cycles cuts a baseline arbitrarily defined as one fluorescence unit. Results correspond to mean values of results from three independent experiments (±standard deviation).

