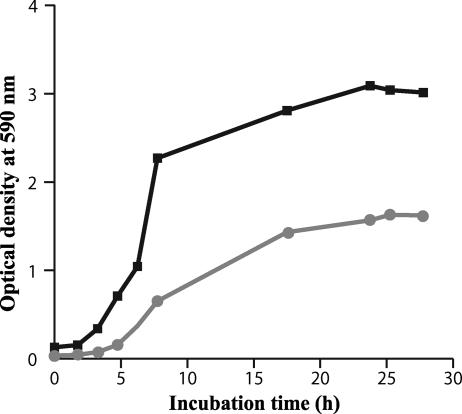
FIG. 6.
Growth curves of C. glabrata isolates 21231 (black) and 21229 (gray). Growth curves were drawn by monitoring the absorbance at 590 nm of cultures in YEPD broth incubated at 37°C for 30 h. Results correspond to mean absorbances of three independent cultures. For each value, the standard deviation did not exceed 10%.

