Figure 1.
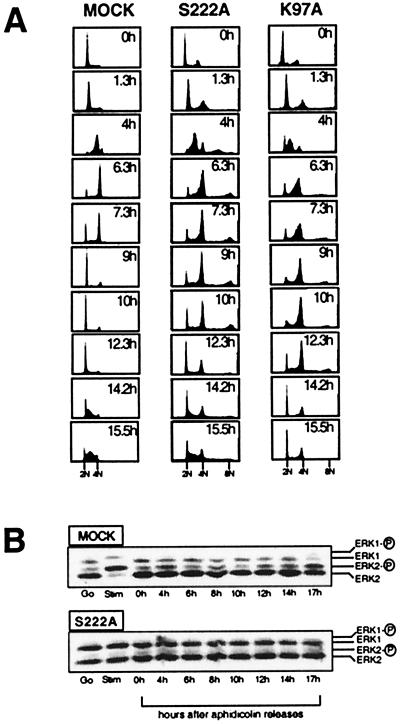
Effects of ectopic expression of dominant-negative MAPKK mutants on cell-cycle progression. (A) FACS profiles of synchronously growing MAPKK1 mutant-expressing cells stained with PI for DNA content are shown. A and B show a profile of cells stained with PI for DNA content at a series of time points after release from an aphidicolin arrest at the G1/S transition. At 0 hr (Upper), when the aphidicolin was removed, cells had 2n DNA content. As they progressed into S phase, the fluorescence intensity per cell increased (peak shifts to the right) to give >2n but <4n. At 6 hr, the majority of the cells had 4n DNA content and accumulated in a G2/M peak. Over the next 3 hr, mock cells progressed through G2 and M, and recovered 2N DNA content in G1 (9 hr). By 15 hr, the mock cells had completed one cell cycle and were entering a second round of S phase. “Mock” is a cell line transfected with the pcDNA3 vector; “S222A” is a cell line transfected with the S222A-MAPKK1 mutant; “K97A” is a cell line transfected with the K97A-MAPKK1 mutant. (B) MAPK phosphorylation in NIH 3T3 cell lines expressing MAPKK1 mutants was measured by gel mobility shift assays of synchronized extracts from mock-transfected and S222A MAPKK-mutant transfected cell lines. The position of unphosphorylated and phosphorylated ERK1 and ERK2 are indicated to the right of each panel.

