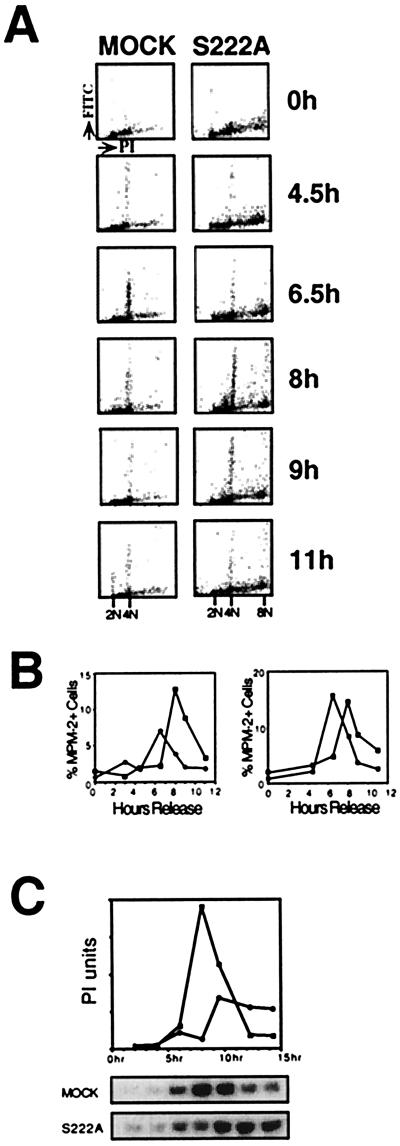
Figure 2.
MAPKK mutants delay the G2/M transition as seen by MPM-2 antibody reactivity and CDC2 activation in synchronized cells. (A) Two-dimensional FACS analysis of cells stained with PI and MPM-2 antibody/FITC secondary antibody were compared from mock and MAPKK-S222A mutant transfected cell lines. Dot plots show the relative PI fluorescence intensity (x axis; linear) vs. the relative FITC/MPM-2 fluorescence intensity (y axis; logarithmic) for the two cell lines at different time points. A representative data set is shown. (B) The relative FITC fluorescence is plotted vs. time from two data sets, one from the data set above (Left) comparing mock-transfected (black circles) and MAPKK S222A mutant-expressing (white squares) cell lines. MAPKK S222E (black squares) and S222A dominant-negative (white squares) MAPKK mutant-expressing cell lines are compared (Right). (C) Comparison of the timing and magnitude of CDC2 activation in MAPKK S222A mutant and mock-transfected cell lines. Autoradiograms of SDS/PAGE analyses of phosphorylated histone H1 and PhosphorImager (PI) quantification of the gels are shown. The x axis is time after release of cells into S phase.

