Figure 3.
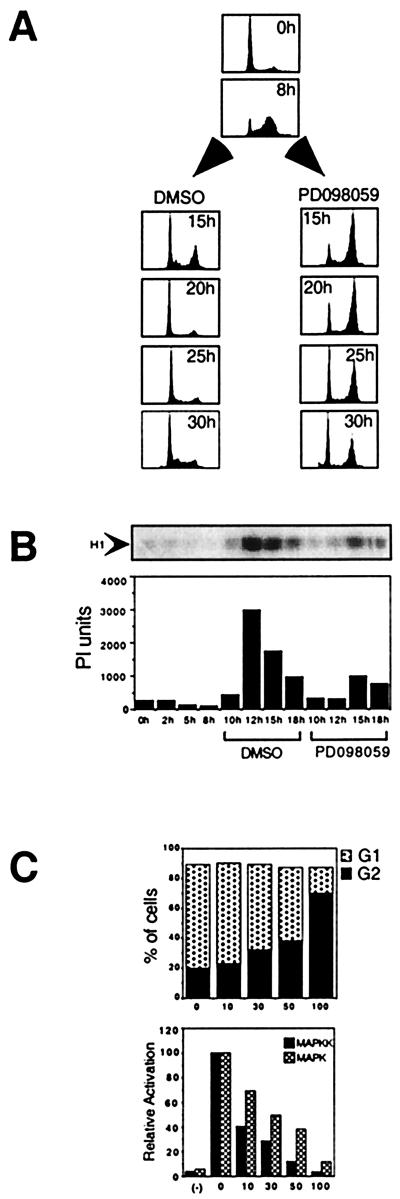
The effect of PD 98059 on G2 progression. (A) Quiescent cells were stimulated with PDGF in the presence of aphidicolin for 20 hr. Cells were released into S phase (0 hr). During late S phase (8 hr), 100 μM PD 98059/DMSO or DMSO alone were added to the cells. At 15, 20, 25, and 30 hr after release, cells were stained with PI for DNA content and analyzed by FACS. (B) The effect of addition of 100 μM PD 98059 to late S phase cells on the subsequent activation of cyclin B-CDC2 complexes. The PD 98059 or DMSO vehicle control was added at the 8-hr time point shown. An autoradiogram of phosphorylated histone H1 is shown. PhosphorImager quantification of the gel is shown graphically below. (C) Comparison of the dose required for kinase inhibition and for the G2 delay. The upper graph shown the percent of cells in G1 (stacked gray bars) and G2 (black bars) as a function of drug concentration 1n micromoles per liter. The PD 98059 was added in late S phase (8 hr), and cells were collected and stained at the 20-hr time point as shown in A. The lower graph shows the relative activity of MAPK and MAPKK as a function of the dose of PD 98059. Quiescent NIH 3T3 cells were treated with the indicated concentration of PD 98059 or DMSO vehicle alone 30 min before stimulation with 0.2 nM PDGF for 3 min. MAPKK activity (black bars) was measured by using a coupled assay with ERK2 as substrate. MAPK activity (gray bars) was measured by using myelin basic protein as substrate.

