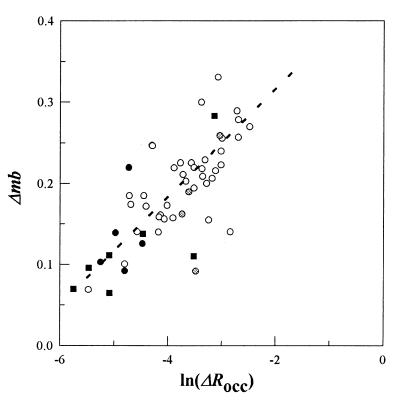
Figure 3.
The Δmb versus ln(ΔRocc) over the 0–0.075 ΔRocc range. About 80% of the total data fell within this range. Scarcity of data precluded an evaluation above the 0.075 ΔRocc value. Culture-to-culture variability, as well as differences in [Asp]pre, contribute to the scatter. The continuous line represents the best fit to the data for E. coli Tar (○). The form, but not the slope, of the fit was robust to a 10-fold variation in ΔRocc values. ● and ■, Responses of S. typhimurium to aspartate photo-release for [Asp]pre values of <0.1 (<25% occupancy) and 50 μM (>95% occupancy), respectively. , E. coli responses to photo-released aspartate in the presence of 250 μM serine (>90% Tsr occupancy).

