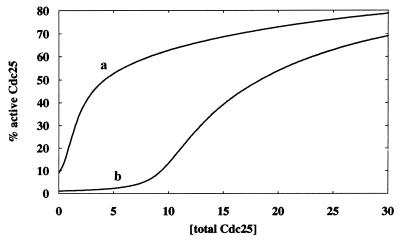
Figure 5.
Percentage of active Cdc25 (measured at steady state) versus total Cdc25. Curve b corresponds to a 100-fold increase in the DNA damage signal strength over that of curve a. Parameter values (dimensionless) for curve a: k2([Chk1P]+[CTAK1]) = kPlk1 = k12 = kPlk1′ = 0.1, k-2 = k-3′ = k-7 = k-18 = k6[p53] = 0.01, k2′([Chk1P]+[CTAK1]) = k3′ = k7 = k13=k18=1.0. Parameter values for curve b are exactly the same as those of curve a except k2([Chk1P]+[CTAK1]) = 10 and k2′([Chk1P]+[CTAK1]) = 100.

