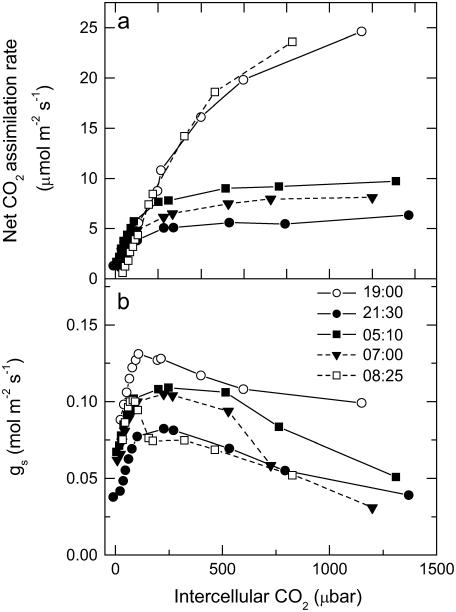
Figure 2.
Net CO2 uptake (A) and gs responses as a function of changing pCO2 measured from late afternoon (phase IV) and throughout the dark period (phase I) and into the light (phase II; B). Representative data are plotted as individual response curves for one leaf at selected intervals during the dark period. Gas exchange measurements were made at an irradiance of 300 μmol quanta m−2 s−1 in the light period, with day/night temperatures of 25°C/20°C and a pCO2 varied against a background gas mixture of 909 mbar nitrogen and 48 mbar of O2.

