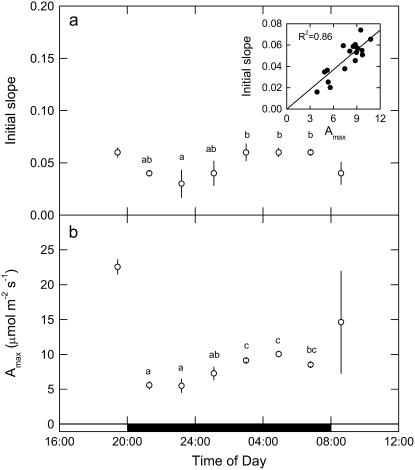
Figure 3.
Initial slope of A/pi response (A) and variation in Amax measured every 2 h from late afternoon (phase IV) and throughout the dark period (phase I) and into the light (phase II; B). Data are plotted as mean ± SEM for three replicate leaves, with inset in A showing the relationship between initial slope and Amax, with experimental details in the Figure 1 legend. Different letters indicate significant differences between plants at P < 0.05.

