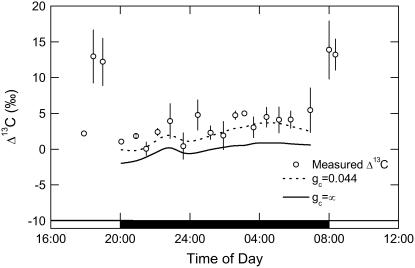
Figure 5.
Δ13C measured in association with gas exchange from late afternoon (phase IV) and throughout the dark period (phase I) and into the light period (phase II), with data (white circles, ±SEM) for three replicate leaves from plants of K. daigremontiana maintained in a controlled-environment chamber on a reverse light/dark cycle. Predicted Δ13C for the dark period (phase I) determined from the model developed in this article (see “Theory” section for details); dashed line is modeled Δ13C including correction for the draw down from substomatal cavity to cytoplasm calculated with gi = 0.044 mol m−2 s−1 bar−1 with Equation 8 and 14 b4 = 6.27‰ at a leaf temperature of 20°C; continuous line is modeled Δ13C using infinite gi (effectively using pi/pa) to parameterize the model.

