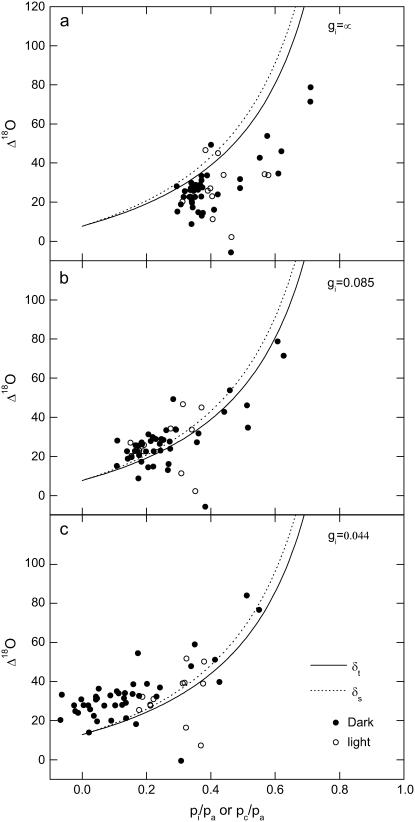
Figure 8.
Δ18O as a function of pi/pa (A) and pm/pa (B and C). In A, no correction was made for gi, whereas in B and C, pm was derived by assuming a gi of 0.0.85 or 0.044 mol m−2 s−1 bar, respectively. The lines are not fitted to the data but represent the theoretical relationship of Δ18O and pi/pa or pm/pa at full isotopic equilibrium, where a = 7.7‰ and Δea = 45‰ or 51‰ using either the average δt or δs values, respectively, in Equation 24. The value of gi = 0.085 in B was estimated from minimizing the variance between measured and theoretical Δ18O calculated with the average δt. The CO2 supplied to the leaf had a Δ18O of 24‰ relative to VSMOW. Data points in each section represent the individual samples collected during light (white circles) and dark (black circles) from three replicate leaves of K. daigremontiana (for details, see Figs. 2 and 5, legends above).

