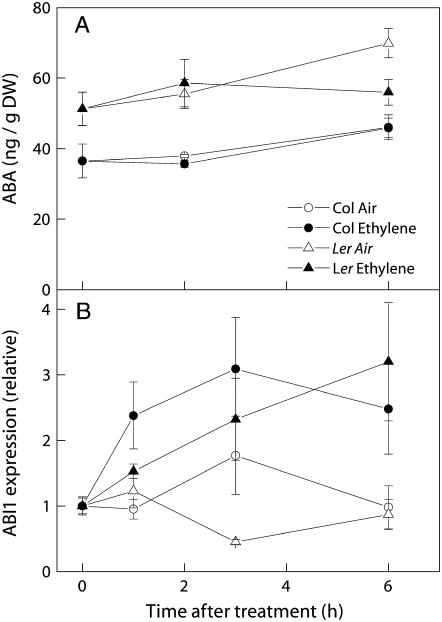
Figure 8.
Concentration of ABA (A) and relative expression of ABI1 (B) in petioles of Col-0 (circles) and Ler (triangles) treated with air (white symbols) or air containing 5 μL L−1 ethylene (black symbols). ABI1 expression was quantified relative to the value obtained at t = 0 h. Means of three or four (A) or six to 16 (B) replicates with ses.

