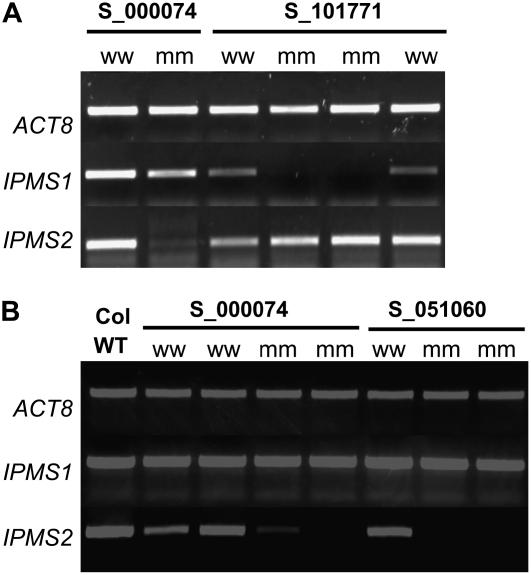
Figure 6.
Semiquantitative RT-PCR analyses of IPMS transcript levels in leaf tissues of Salk T-DNA insertion lines, homozygous (mm) for the insertion or lacking the insertions (ww), and Col-0 wild type (WT). A, Results for the IPMS1 mutant line S_101771 compared to the IPMS2 mutant line S_000074; B, results for the IPMS2 mutant lines S_000074 and S_051060.

