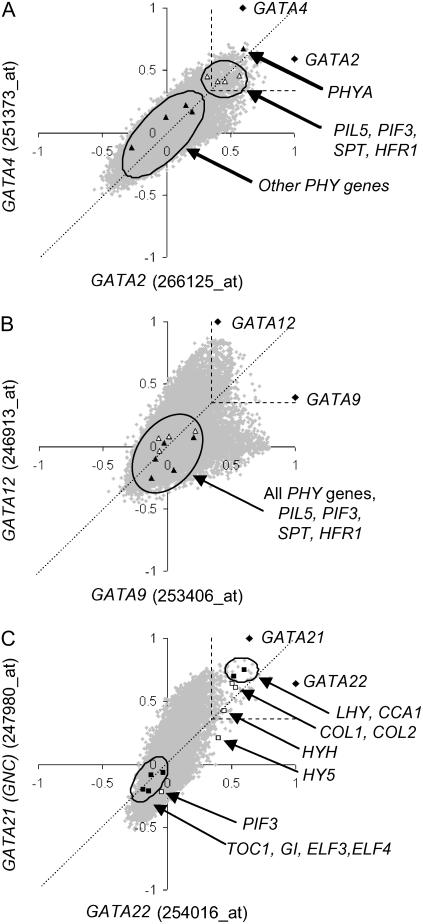
Figure 6.
ACT scatter plot comparison of duplicate gene expression. Scatter plots of r values for correlation of expression of all genes in the ACT database against pairs of GATA genes with similar expression patterns. A, GATA2 and 4. B, GATA9 and 12. C, GATA22 and GNC. On each diagram, the query genes are represented by black diamonds. In A, phytochrome apoprotein genes and a selection of transcription factor genes (see text for details) are represented by black and white triangles. In C, genes encoding clock-related components and other transcription factor genes are represented by black and white squares, respectively. The position of the r value corresponding to a P value of 1 × 10⁻¹⁰ is shown as a guideline significance threshold.

