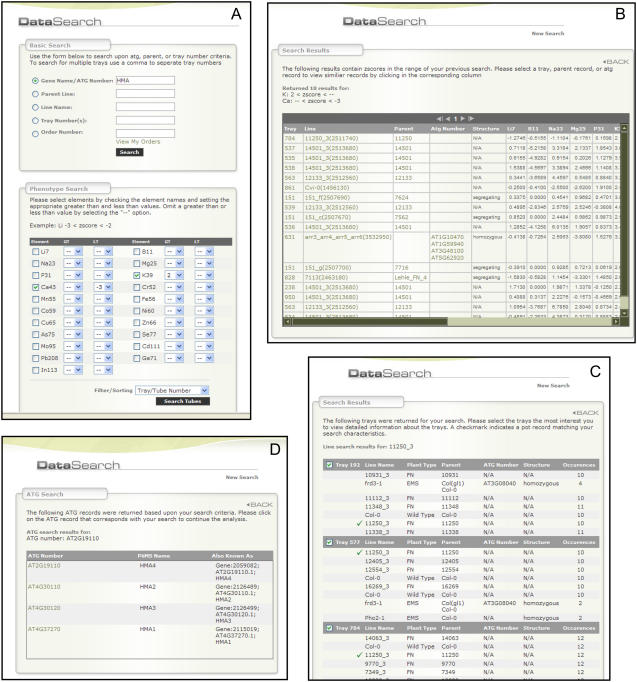
Figure 2.
Modules accessed through the Data Search portal. These include the primary search interface (A), the output of searches based on ionomic phenotype (low Ca, high K; B) or gene name (NHX; D), and the list of experiments the lines returned from the phenotype search (C). [See online article for color version of this figure.]

