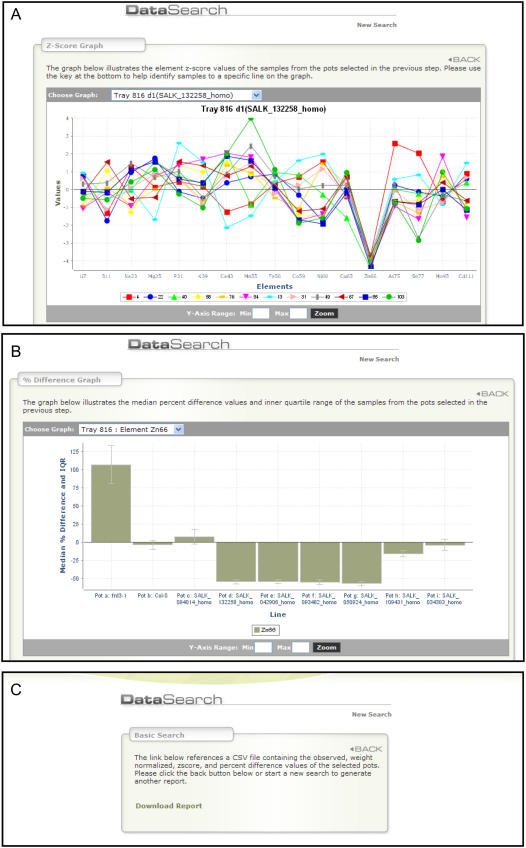
Figure 3.
Visualization of selected ionomic data on the HMA4 mutants as a plot of z-scores (number of sds away from the mean of the wild type grown in the same experiment; A), and median percentage change from the wild type (B) for each element analyzed. Data can also be downloaded as a comma-delimited text file (csv) for further processing on a local machine or summarized in portable document format (pdf; C).

