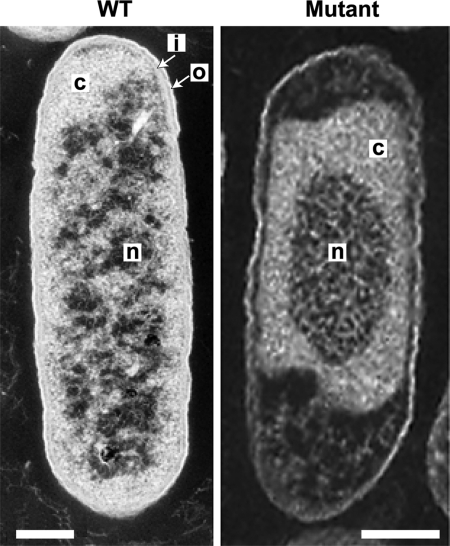
Fig. 2.
Transmission electron micrographs show compaction of the nucleoid and disruption of the cell envelope in the mutant. The WT (Left) and mutant (Right) were grown in Mops medium for 3 h (see Materials and Methods). Each cell is representative of the strain and both were included in the relative nucleoid cross-sectional area analyses. Structure designations: n, nucleoid; c, cytoplasm; i, inner membrane; o, outer membrane. (Scale bars: 200 nm.)

