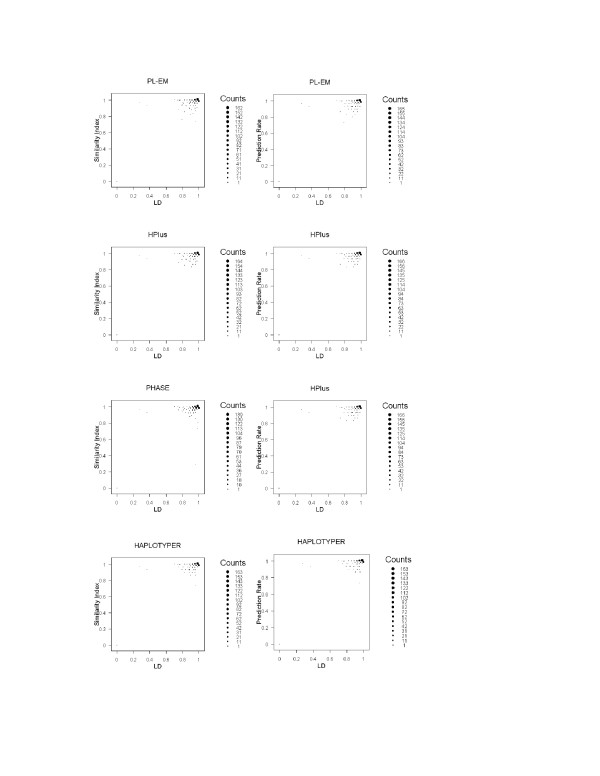
Figure 2.
The relationship between the performances of haplotyping methods and the linkage disequilibrium (LD) of the haplotypes within blocks. The plots illustrate for the performances (in similarity Index and Prediction Rate) of empirical methods (PL-EM and HPlus) and Bayesian methods (PHASE and HAPLOTYPER) on analyzing the 500 randomly selected haplotype blocks of the 30 European mothers' genotypes on X-chromosome.

