
Figure 2. Growth rates of mutant panel.
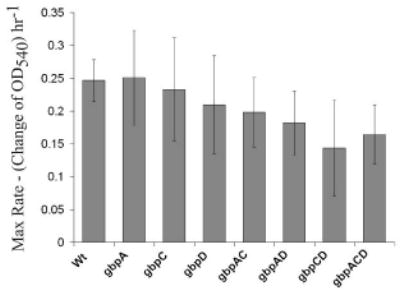
Values represent the slope of a curve fit to graphs of 3 independent growth trials at the time when the OD540 is at ½ max OD (S value of plot equation). This represents the maximum change in OD for each strain which is assumed to be the maximal growth rate. Error bars are 1 standard deviation of the S value.