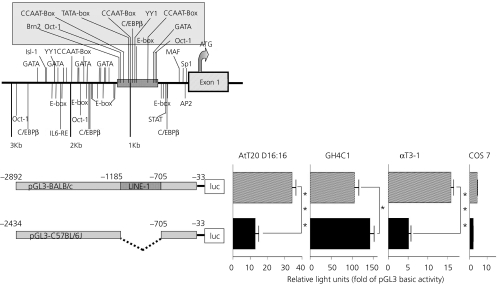
Fig. 5.
Transient expression of the Vipr2 5′ flanking sequences derived from BALB/c and C57BL/6J VPAC2 receptor genes in AtT20, GH4C1, αT3-1 and COS 7 cells. The positions of the L1 sequence and potential transcription factor binding sites are indicated in the schematic diagram of this region in the upper left. Luciferase activities (firefly and Renilla) were measured in cell lysates and normalised to Renilla luciferase activity. Results are shown as fold over pGL3 Basic activity (2.6 ± 0.7 rlu; 0.31 ± 0.22 rlu, 0.38 ± 0.05 rlu and 1.1 ± 1.1 rlu for AtT20, GH4C1, αT3-1 and COS 7 cells, respectively) and are the means ± SEM of six to nine separate measurements (***P < 0.001, *P < 0.05, one-tailed Student t-test).

