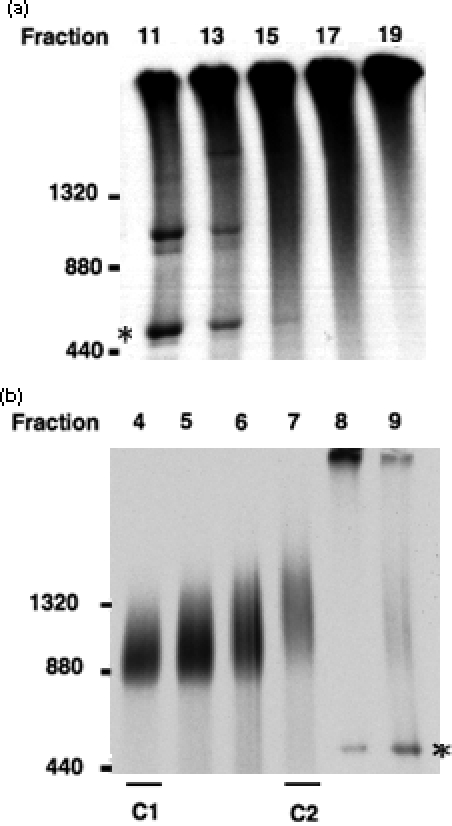
Figure 3. Blue-native PAGE analyses of fractions from the two precursor peaks.

Fractions 11–19 (a) or fractions 4–9 (b) of the 20-min import samples as shown in Figure 2(a) were analyzed by BN-PAGE. Molecular masses (in kDa) are labeled according to the migration positions of ferritin monomer (440), dimer (880), and trimer (1320). Asterisks indicate the position of Rubisco holoenzyme.
