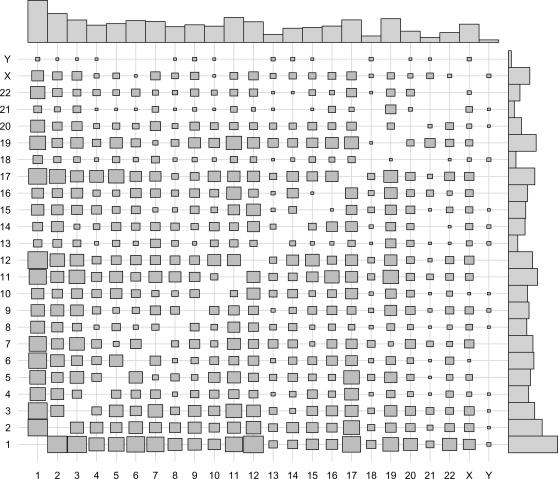
Figure 2. Gene interaction plot.
Mosaic plot of gene interactions for 2651 EST chimeras where the direction of the participating partners is the same. The size of each square is proportional to the number of times a fusion event is observed between chromosomes i and j, for i,j∈1,2,…,22,X,Y. The barplots represent known gene densities on each chromosome, according to Ensembl gene counts for all chromosomes.

