
Figure 6.
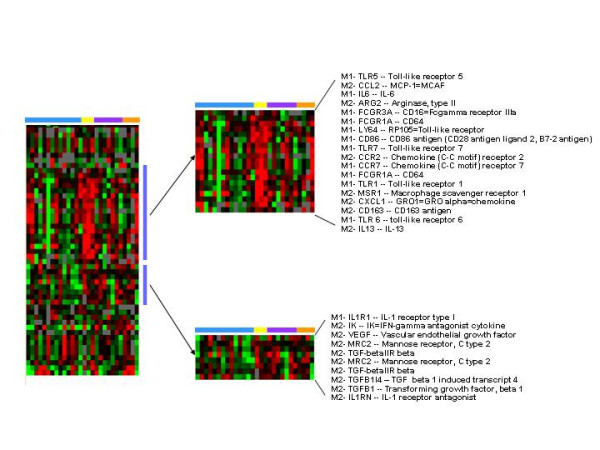
Analysis of the expression of macrophage genes. Genes characteristic of M1 and M2 macrophages were selected according to a list of transcripts reported in the literature [21,22,25] to be modulated by these cell subsets and were analyzed by supervised hierarchical clustering which revealed two clusters. The first cluster was a mix of M1 and M2 genes whose expression was greatest on day 2. The second cluster was predominantly M2 genes and their expression was greatest on day 4 and 8. Pre and post wound biopsies are color coded by the horizontal bars as per figure 1.