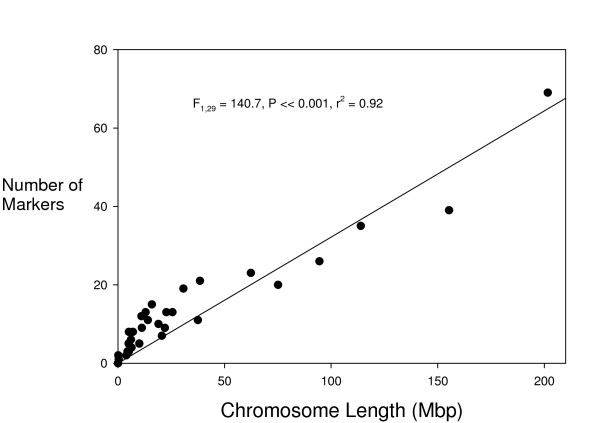
Figure 1.

Regression of number of in silico mapped EST-SSRs on chicken chromosome length. Chicken chromosomes are generally numbered largest first, so chromosome 1 is the data point in the top right corner. Chromosome length is a good predictor of the number of mapped EST-SSR loci. However, microchromosomes are relatively EST-SSR abundant relative to macrochromosomes (chromsomes 1–5 and Z).
