Figure 5.
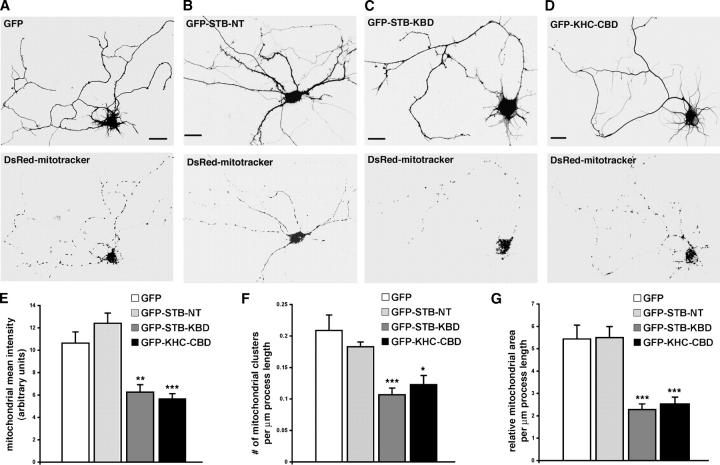
Expression of the KHC-CBD or the STB-KBD reduces mitochondrial density in neuronal processes. (A–D) Cultured hippocampal neurons (DIV5) were transfected with DsRed-mitotracker and expression vector encoding GFP control (A), GFP-STB-NT (B), GFP-STB-KBD (C), or GFP-KHC-CBD (D). Mitochondrial distribution in the neuronal processes was examined by imaging GFP fluorescence (top panels) and DsRed-mitochondria (bottom panels) 48–72 h after transfection. Neurons transfected with GFP-KHC-CBD or GFP-STB-KBD showed a marked reduction in the density of mitochondria along the neuronal processes relative to that of neurons transfected with GFP or GFP-STB-NT. Bars, 10 μm. (E–G) Quantification of the relative mitochondrial density in neuronal processes. Relative mitochondrial density was expressed as the fluorescence mean intensity of DsRed-mitotracker per square unit area of process of transfected neurons (E), number of mitochondrial clusters (F), or relative mitochondrial area (G) per μm of process length of transfected neurons. All images were collected under the same settings below saturation and from 15 neurons for each group in three independent experiments. Total process length measured was 4111.7 μm (GFP), 4148 μm (GFP-STB-NT), 3963.74 μm (GFP-STB-KBD), or 3053.97 μm (GFP-KHC-CBD). Histograms indicate mean ± SEM. *P <0.01; **P < 0.002; ***P < 0.001 relative to GFP controls by t test.

