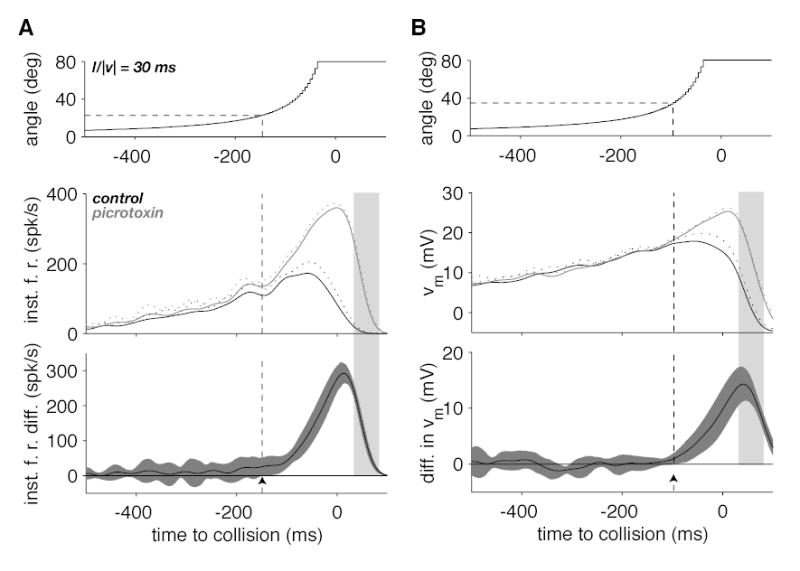
Figure 3.

Effect of picrotoxin on the time-course of the LGMD instantaneous firing rate and membrane potential during a looming stimulus. A. The top panel illustrates the time course of the stimulus angular size as a function of time to collision. The middle panel shows the time course of the firing rate (mean and mean + SD, solid and dotted lines) in control (black) and picrotoxin conditions (gray). The bottom panel illustrates the firing rate difference between the picrotoxin and control conditions (black line) as well as its 95% confidence interval (gray). The arrowhead shows the location where the lower confidence interval boundary crosses the zero difference line corresponding to a statistically significant change in firing rate. The time when statistical significance is reached and the corresponding angular size are given by the dashed vertical and horizontal lines, respectively. B. Time-course of the stimulus (top), median, low-pass filtered membrane potential (middle) and the difference in median, low-pass filtered membrane potential (bottom panel). Same plotting conventions as in A. Data illustrated in A and B correspond to the data illustrated in Fig. 1A. The light grey shaded area delimits the same time interval as in Fig. 1A and B.
