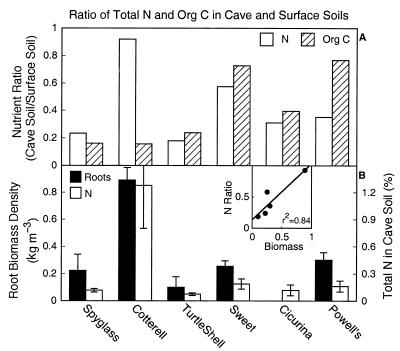
Figure 3.
(A) The ratio of total N and C concentrations of cave soils relative to surface soils at six cave sites. (B) Root biomass density (kg m−3) and total N (%) in cave soil. The caves are arranged in order of increasing depth from left to right; see Table 1 for the location and depth of each cave. (Inset) The relationship between root biomass density in cave soils and the proportion of total N in cave soil relative to surface soil (r2 = 0.84; P = 0.03).

