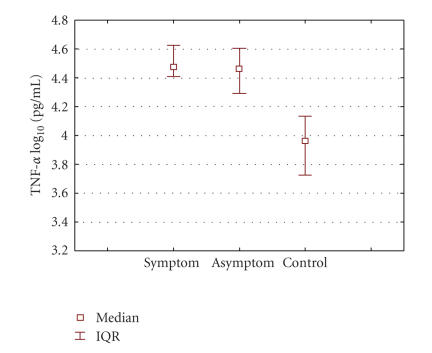
Figure 1.
Graphic representation of median TNF-alpha concentrations in symptomatic, asymptomatic, and control groups. Data represent the median log 10 cytokine contents (IQR) per milliliter. Significance: symptomatic group compared to control: median 4.47 (IQR: 4.44–4.61) pg/mL versus 3.96 (IQR: 3.86–4.10) pg/mL; P < .001. Group with asymptomatic lesions compared to control: median 4.46 (IQR: 4.28–4.60) pg/mL versus 3.96 (IQR: 3.86–4.10) pg/mL; P < .001.

