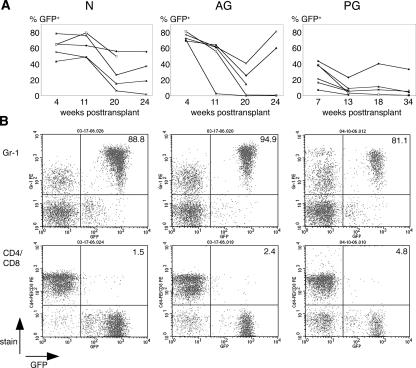
Figure 3.
Engraftment and differentiation of in vitro derived hematopoietic progenitors from N, AG, and PG ES cells in irradiated recipients. (A) The percent GFP-positive, ES cell-derived cells in the peripheral blood of recipients at indicated time points post-transplantation. (N) N line 2 (E14) (Hooper et al. 1987); (AG) AG line 3 (MM9) (McLaughlin et al. 1997); (PG) B6129F1 PG ES cell line 1. The range of contribution of N-, AG-, and PG-derived cells is similar to previous observations (Kyba et al. 2002). In a different experiment, PG line 1-derived cells were also transplanted into Rag2−/−, γC−/− recipient mice (Mazurier et al. 1999), and exhibited contribution levels of up to 95% of the peripheral blood of recipients (data not shown). (B) FACS analysis of peripheral blood of representative recipient mice at 20 wk (N; AG) and 13 wk (PG) post-transplantation. The fluorescence intensity of GFP (marking ES cell-derived cells) is indicated on the X-axis, the fluorescence intensity of differentiation markers (myeloid: Gr-1; T-cell: CD4/CD8) is indicated on the Y-axis. Numbers represent the percentage of GFP-positive donor cells that express the respective differentiation antigen.

