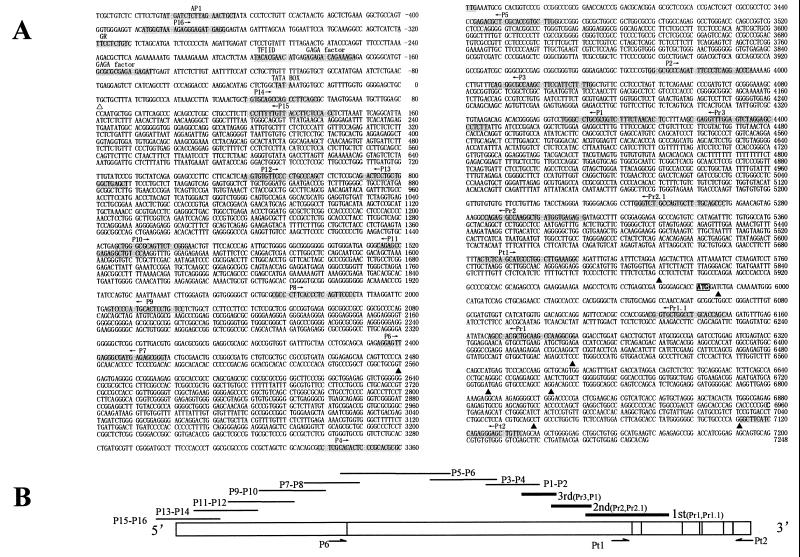
Figure 2.
(A) Sequence of the 5′ flanking region and exon 1 of PLZF. Open triangle points to the putative transcription start site. Possible binding sites of transcription factors are shadowed, and primers for PCR are indicated. Filled triangles indicate alternative splicing sites (AS-I through AS-IV). (B) Schematic representation of RACE and RT-PCR results of the extended exon 1. The upper solid lines indicate alignment of PCR fragments. The three thick lines at the right represent RACE results. Vertical lines within the exon 1 box denote alternative splicing sites. Arrows indicate primers for amplification of alternatively spliced fragments (see Fig. 3 A and B).

