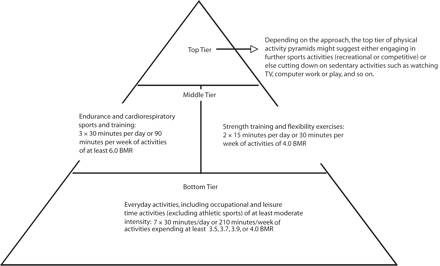
FIGURE 1—

Generalized physical activity pyramid model quantified for simulation purposes.
Note. Only the bottom and middle tiers were considered in the simulations. Each of the 4 bottom-tier scenarios defining “moderate” physical activity in terms of minimum recommended basal metabolic rate (BMR) multiples of energy expenditures was examined in the simulations.
