
FIGURE 3—
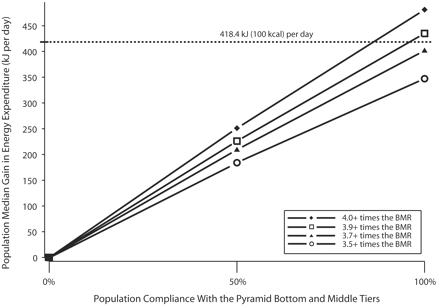
Sample median gains in energy expenditure (kJ per day), stratified according to level of compliance with 3.5+, 3.7+, 3.9+, and 4.0+ basal metabolic rate (BMR) bottom-and middle-tier physical activity pyramid recommendations.
Official websites use .gov
A
.gov website belongs to an official
government organization in the United States.
Secure .gov websites use HTTPS
A lock (
) or https:// means you've safely
connected to the .gov website. Share sensitive
information only on official, secure websites.
Sample median gains in energy expenditure (kJ per day), stratified according to level of compliance with 3.5+, 3.7+, 3.9+, and 4.0+ basal metabolic rate (BMR) bottom-and middle-tier physical activity pyramid recommendations.