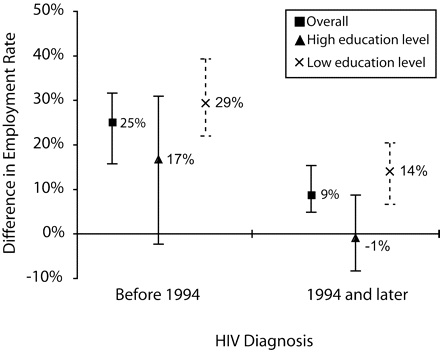
FIGURE 2—

Difference in employment rates (and 95% confidence intervals [CIs]) with the French general population for persons diagnosed with HIV before 1994 and from 1994 onward, overall and according to educational level.
Note. For example, the employment rate of HIV-infected individuals diagnosed from 1994 onward who have a low education level is 14% lower (95% CI = 7%, 20%) than that of individuals who have a comparable educational level in the general population.
