
FIGURE 1—
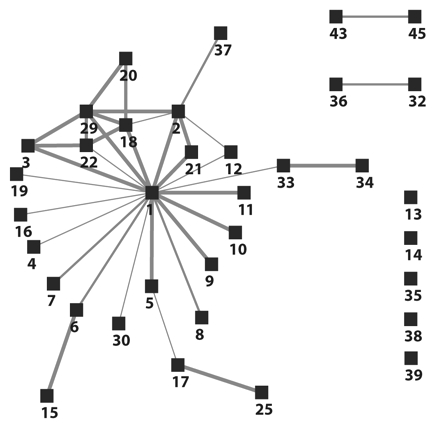
Visualization of the identified links among the first 35 tuberculosis patients during an outbreak investigation in southwest Oklahoma, 2002.
Note. This diagram was compiled using only the existing contact investigation records obtained before or during the Centers for Disease Control and Prevention on-site investigation. Tuberculosis patients are represented by black boxes. Gray lines represent the links between patients. Decreasing thicknesses of gray lines represent the strength of relationship between patients: close, casual, or undetermined, respectively.