
FIGURE 3—
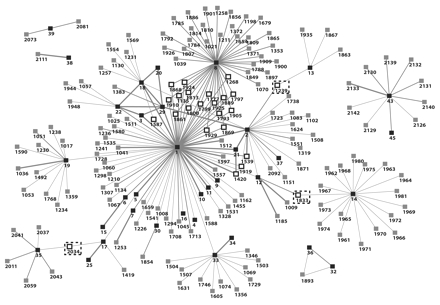
Visualization of the first 35 tuberculosis (TB) patients and all contacts in need of clinical evaluation for TB and latent TB infection in southwest Oklahoma, 2002.
Note. Critical contacts with high betweenness and reach centrality metrics are indicated. TB patients are represented by black boxes with 1- or 2-digit numbers. Gray boxes with 4-digit numbers represent unevaluated contacts at the time of CDC investigation. White boxes with 4-digit numbers represent priority contacts. Contacts surrounded by dashed boxes are those with high betweenness. Gray lines represent the links between contacts and patients. Decreasing thicknesses of gray lines represent the strength of the relationship between patients and type of contacts: close, casual, or undetermined, respectively.